Detect the leak before it becomes a disaster.
Gas pipelines, water mains, and electricity grids are invisible until something goes wrong. AdvaIoT makes them visible — and keeps them safe before the leak, the outage, or the explosion.
35%→19%
NRW reduction
Within 6 months post-deployment
4h
Advance fault warning
Gas leak prediction capability
KES 45M+
Annual revenue recovery
From NRW programme alone
Real-time
Grid visibility
All substations monitored live
What's broken in Utilities & Infrastructure today
Africa's utility infrastructure operates under enormous pressure with limited monitoring resources. Gas distribution networks carry explosive product through aging pipes with no automated pressure surveillance — a slow leak builds for weeks before it reaches explosive concentration in a confined space and tragedy strikes. Water utilities lose 30–40% of distributed water to non-revenue losses through burst mains that aren't detected until pressure drops affect customers far downstream. Electricity distribution companies discover transformer overloads only after the transformer has already failed, leaving thousands without power.
Manual inspection schedules are designed around what field staff can physically visit — not around what the infrastructure actually needs. A critical pressure anomaly can develop and escalate in the 3 weeks between inspection visits. Predictive maintenance is impossible without continuous sensor data. Utilities are in constant reactive mode, spending their budgets on emergency repairs rather than planned maintenance that costs a fraction of the price.
AdvaIoT deploys networks of IoT pressure, flow, and electrical sensors across utility infrastructure to create continuous, automated surveillance of the assets that matter most. Gas pipeline pressure sensors report every 15 minutes and immediately flag deviations from normal operating range that indicate a developing leak, blockage, or pressure loss. Water main flow meters identify district metering areas where inflow significantly exceeds consumption — precisely locating the zone where a burst pipe is losing water before field staff even deploy.
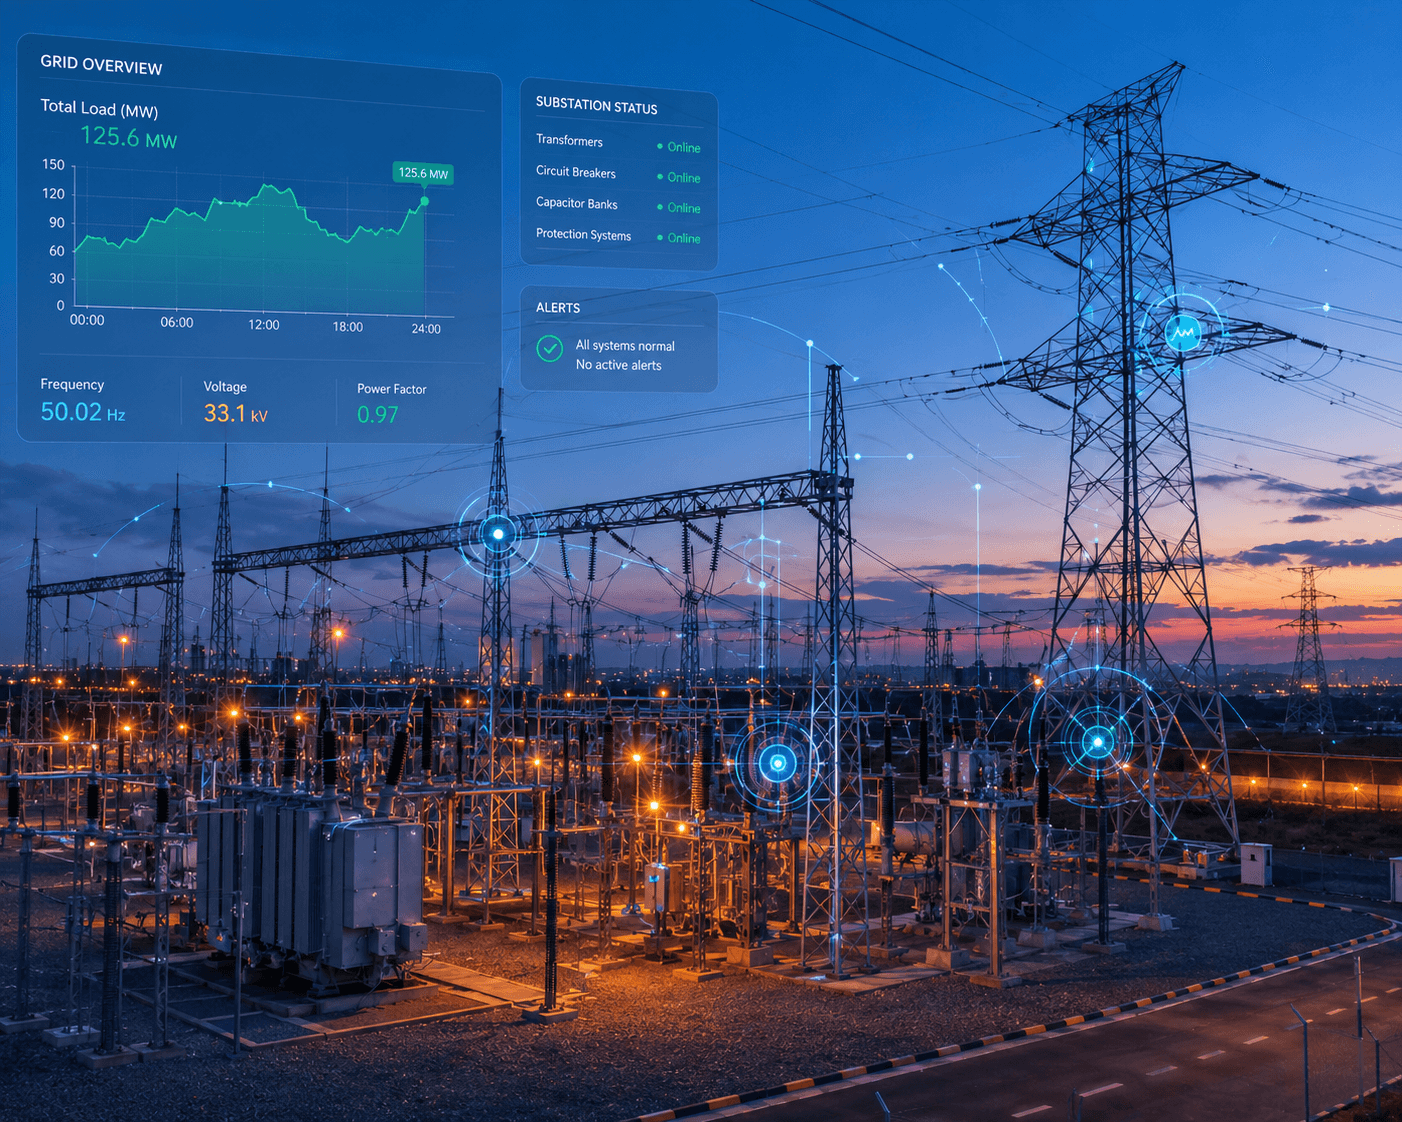
On electricity networks, smart substation sensors monitor transformer temperature, load factor, and voltage quality in real time. Overload conditions trigger alerts that allow load balancing before transformers fail. Smart meters with consumption profiling identify theft and metering fraud at the customer level. A single unified dashboard gives utility operations teams visibility across all three service types — water, gas, and power — from one screen.
Turning utilities & infrastructure data into decisions
- Gas pipeline pressure monitoring with instant leak and fault alerts
- Smart electricity metering for theft detection and overload prevention
- Water main flow sensors to reduce non-revenue water losses
- Predictive maintenance alerts based on consumption and pressure trends
- Unified utility operations dashboard for multi-service providers
Capabilities
Purpose-built IoT solutions for utilities & infrastructure operations across Africa.
Gas Pipeline Pressure Monitoring
Continuous pressure sensing on gas distribution mains. Instant alerts on pressure drops indicating leaks, pressure surges indicating blockages, and values outside safe operating range.
Water Main Leak Detection
District metering zone flow meters with balance calculations identify loss zones. Night minimum flow analysis pinpoints active leakage. Reduces non-revenue water and prevents burst main events.
Electricity Grid Monitoring
Smart substation sensors monitoring transformer temperature, load, voltage, and power factor. Overload and fault alerts dispatched to maintenance teams before equipment failure.
Predictive Fault Detection
Machine learning models trained on sensor data identify anomaly patterns that precede equipment failures — giving maintenance teams time to act before the fault becomes an emergency.
Utility Operations Dashboard
Unified view of water, gas, and electricity infrastructure status. Active alerts, historical trends, maintenance scheduling, and field crew dispatch management in one platform.
Theft & Tampering Detection
Smart meter tamper alerts, consumption anomaly profiling, and current transformer bypass detection for electricity theft. Illegal bypass connection detection for gas.
Maintenance Management Integration
Sensor-triggered maintenance work orders dispatched directly to field teams via mobile app. Engineers see fault location, asset details, and recommended action before they reach the site.
Regulatory Reporting
Automated generation of service reliability reports, loss accounts, and environmental compliance submissions for EPRA, WRMA, and other sector regulators.
How it works in the field
Gas Distribution Safety
The Situation
A gas distribution company serving 4,000 commercial and industrial customers was operating its distribution network without automated pressure monitoring. A slow leak on a main in a commercial zone was detected only when a customer reported a smell — by which time concentration in a basement had reached dangerous levels.
The Outcome
Continuous pressure sensors on all distribution mains with low-pressure thresholds alerted the operations centre to a pressure deviation 4 hours before it reached hazardous concentration levels. The leak was located and repaired before any evacuation was necessary. Safety reporting to ERC confirmed proactive detection.
Non-Revenue Water Reduction Programme
The Situation
A water utility distributing 60 million litres daily was losing an estimated 35% as non-revenue water. Without district metering, the utility could not identify which zone or pipe was responsible, making repair prioritisation impossible.
The Outcome
District metering zones with inlet and outlet flow meters identified the top 5 loss zones within 3 months. Targeted pipe repair and illegal connection enforcement reduced NRW from 35% to 19%. Annual revenue recovery exceeded 45M KES.
Transformer Overload Prevention
The Situation
A distribution company had experienced 7 transformer failures in 12 months across a rapidly growing peri-urban area where load was increasing with new construction. Replacements cost 1.2M KES each and took 5–7 days to install, causing customer outages.
The Outcome
Temperature and load sensors on 45 critical transformers identified 6 units operating at sustained overload conditions. Load balancing and scheduled upgrades of the overloaded units eliminated further unplanned failures. Savings from prevented failures and avoided outages exceeded the sensor deployment cost within 8 months.
How we deploy
Network Assessment
Our engineers review network schematics, historical fault data, and inspection records to identify the highest-risk monitoring points across your water, gas, or electricity network.
Sensor Installation
Pressure loggers, flow meters, and electrical sensors are installed by certified utility engineers. Hot-tap installations for water mains ensure no service interruption during sensor fitting.
Telemetry & Alert Configuration
Data telemetry is configured to your operations centre dashboard. Alert thresholds are set based on historical operating data and regulatory requirements. Field crew dispatch workflows are established.
Predictive Analytics Calibration
As sensor data accumulates over the first 3–6 months, our data team trains anomaly detection models on your specific infrastructure patterns, progressively improving early warning capability.
Proof in the field
A water utility distributing 60 million litres daily across 3 counties
Challenge: 35% non-revenue water losses with no visibility into which zones were losing the most. Emergency pipe repairs were consuming 40% of the maintenance budget with no prevention strategy.
Result: District metering zones identified the top 5 loss areas within 3 months. Targeted repair and enforcement reduced NRW to 19%. Emergency repair costs fell by 55% as planned maintenance replaced reactive response.
35%→19%
NRW reduction
55%
Emergency repair cost saving
KES 45M
Annual revenue recovery
3 months
Loss zone identification
Early
Fault detection
35%
Loss reduction
Real-time
Grid visibility